Draft Windows screens are real, from the Demo login with made-up data. Hatched plates are Android screens still to come. Copy is a draft.

 by CoreWave Studio
Reports
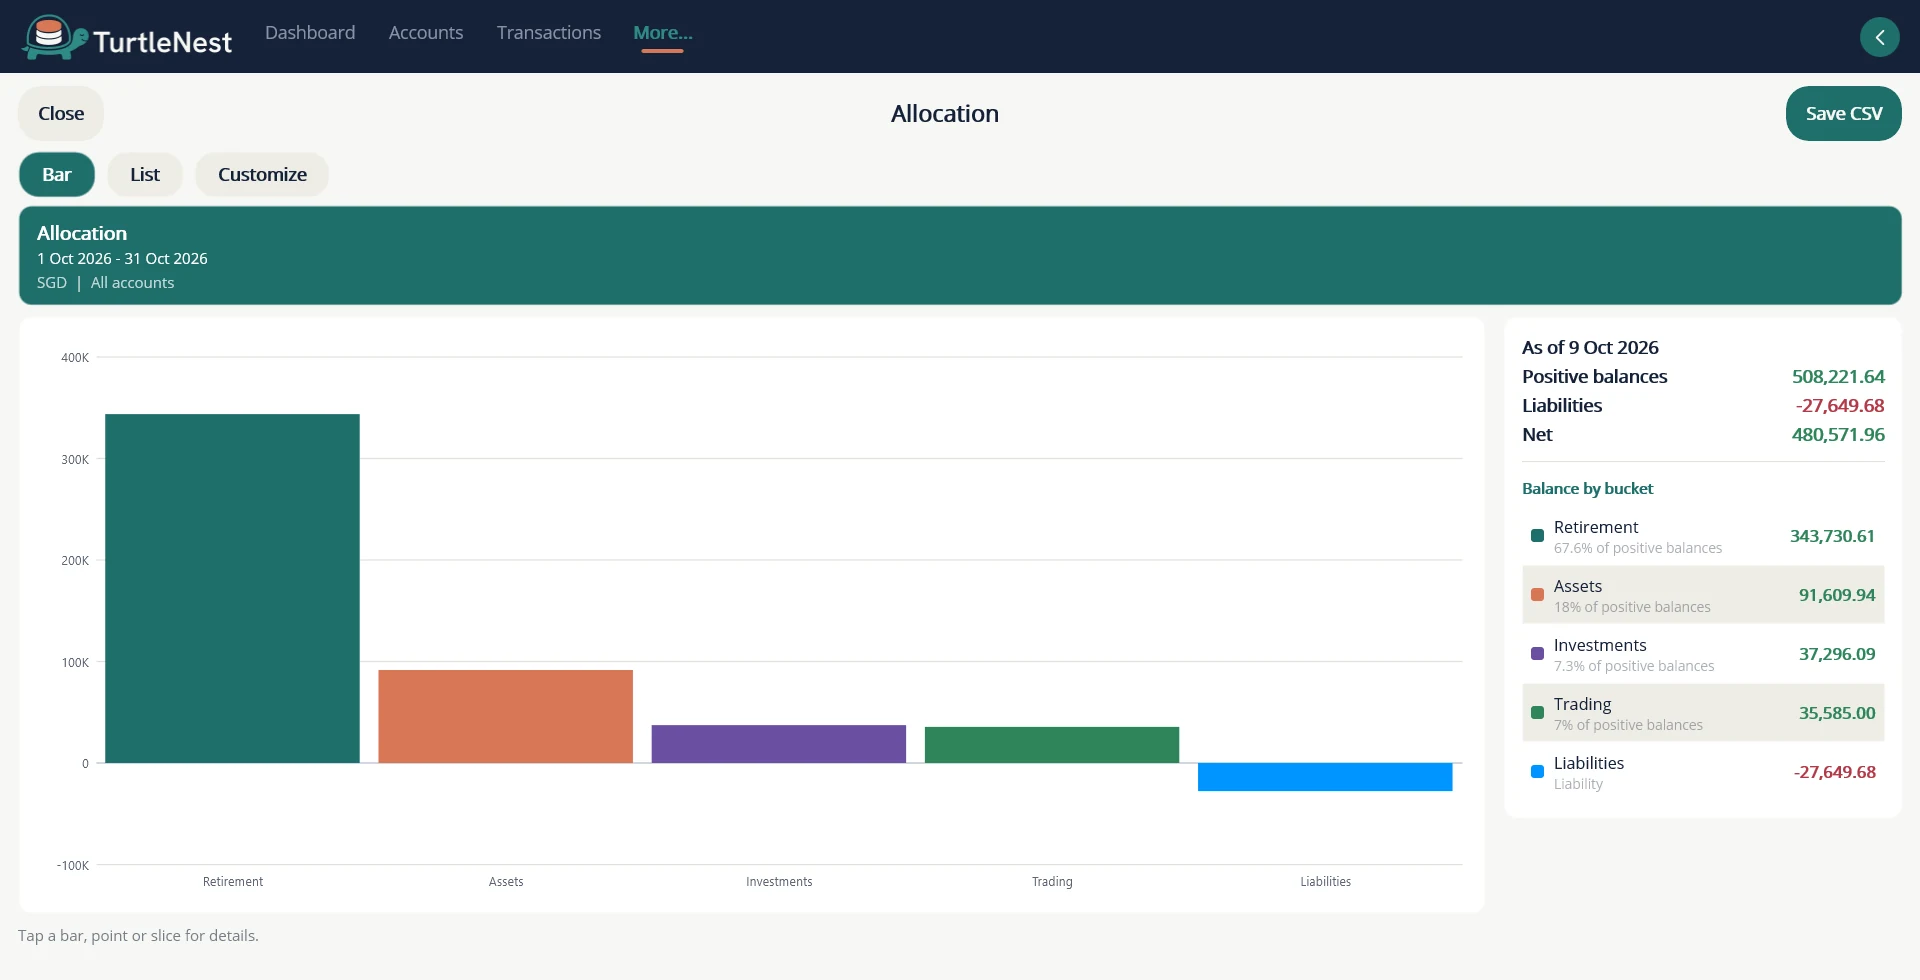
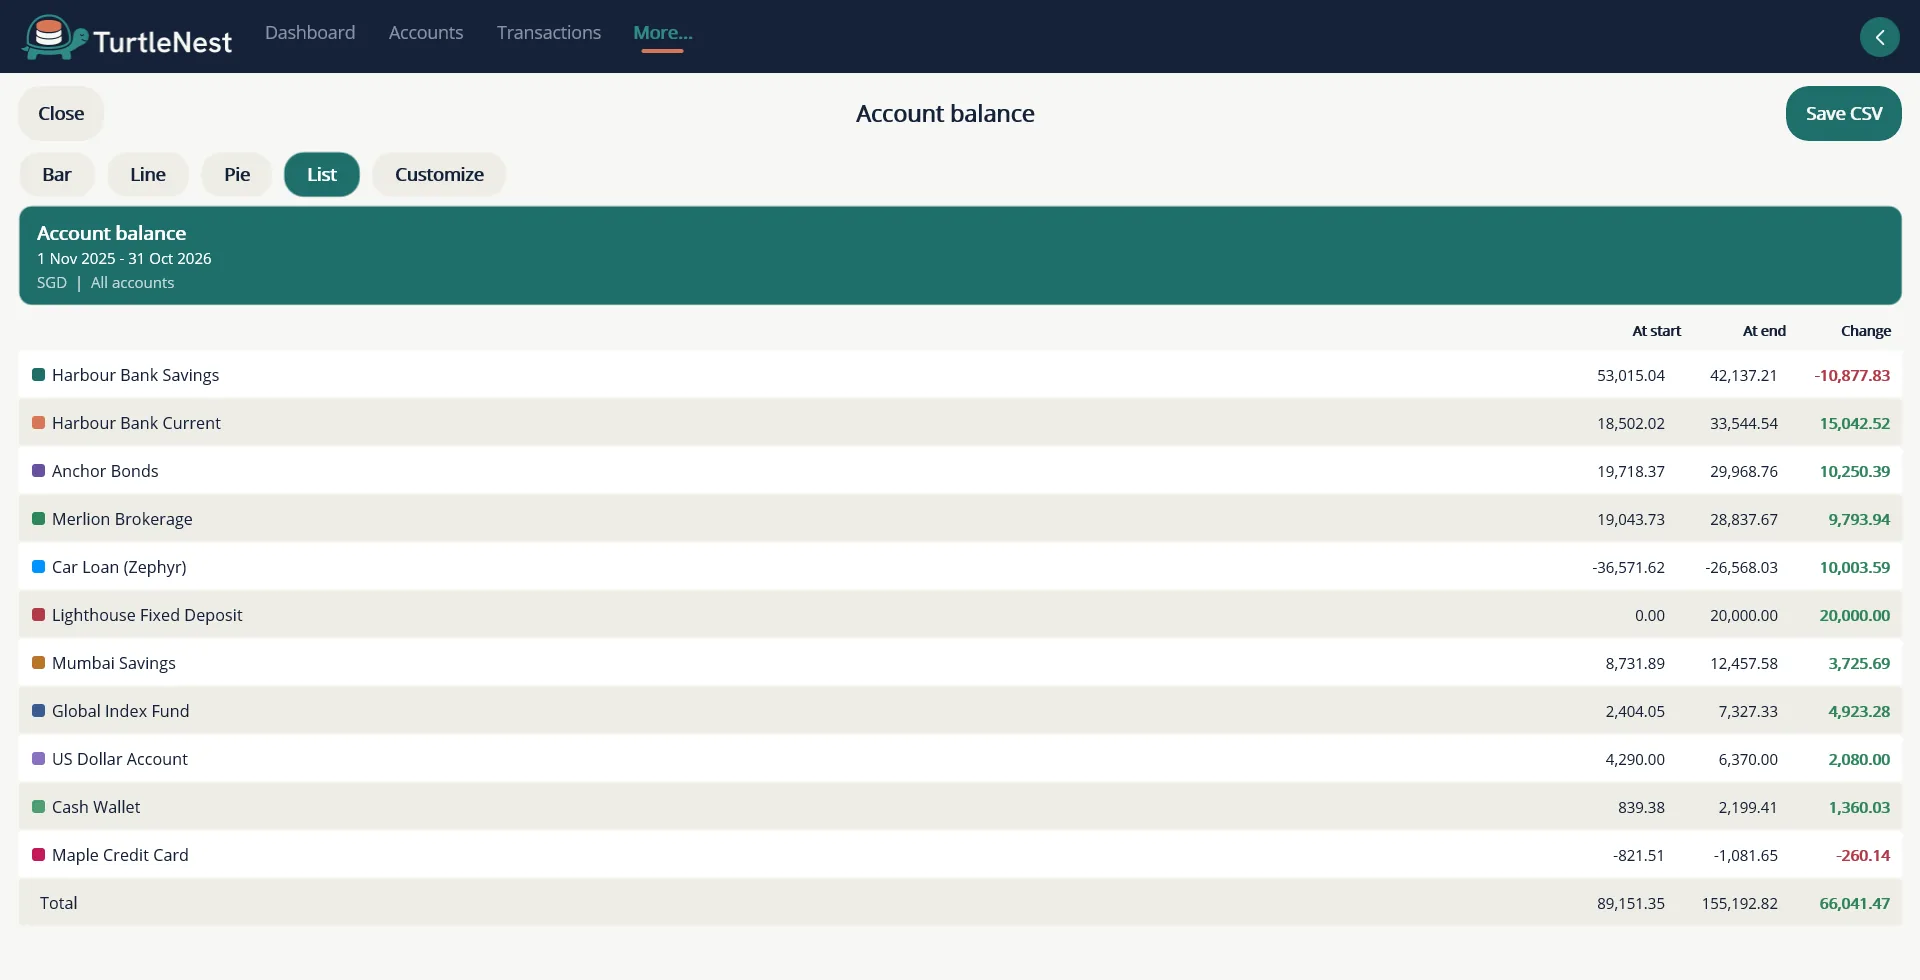
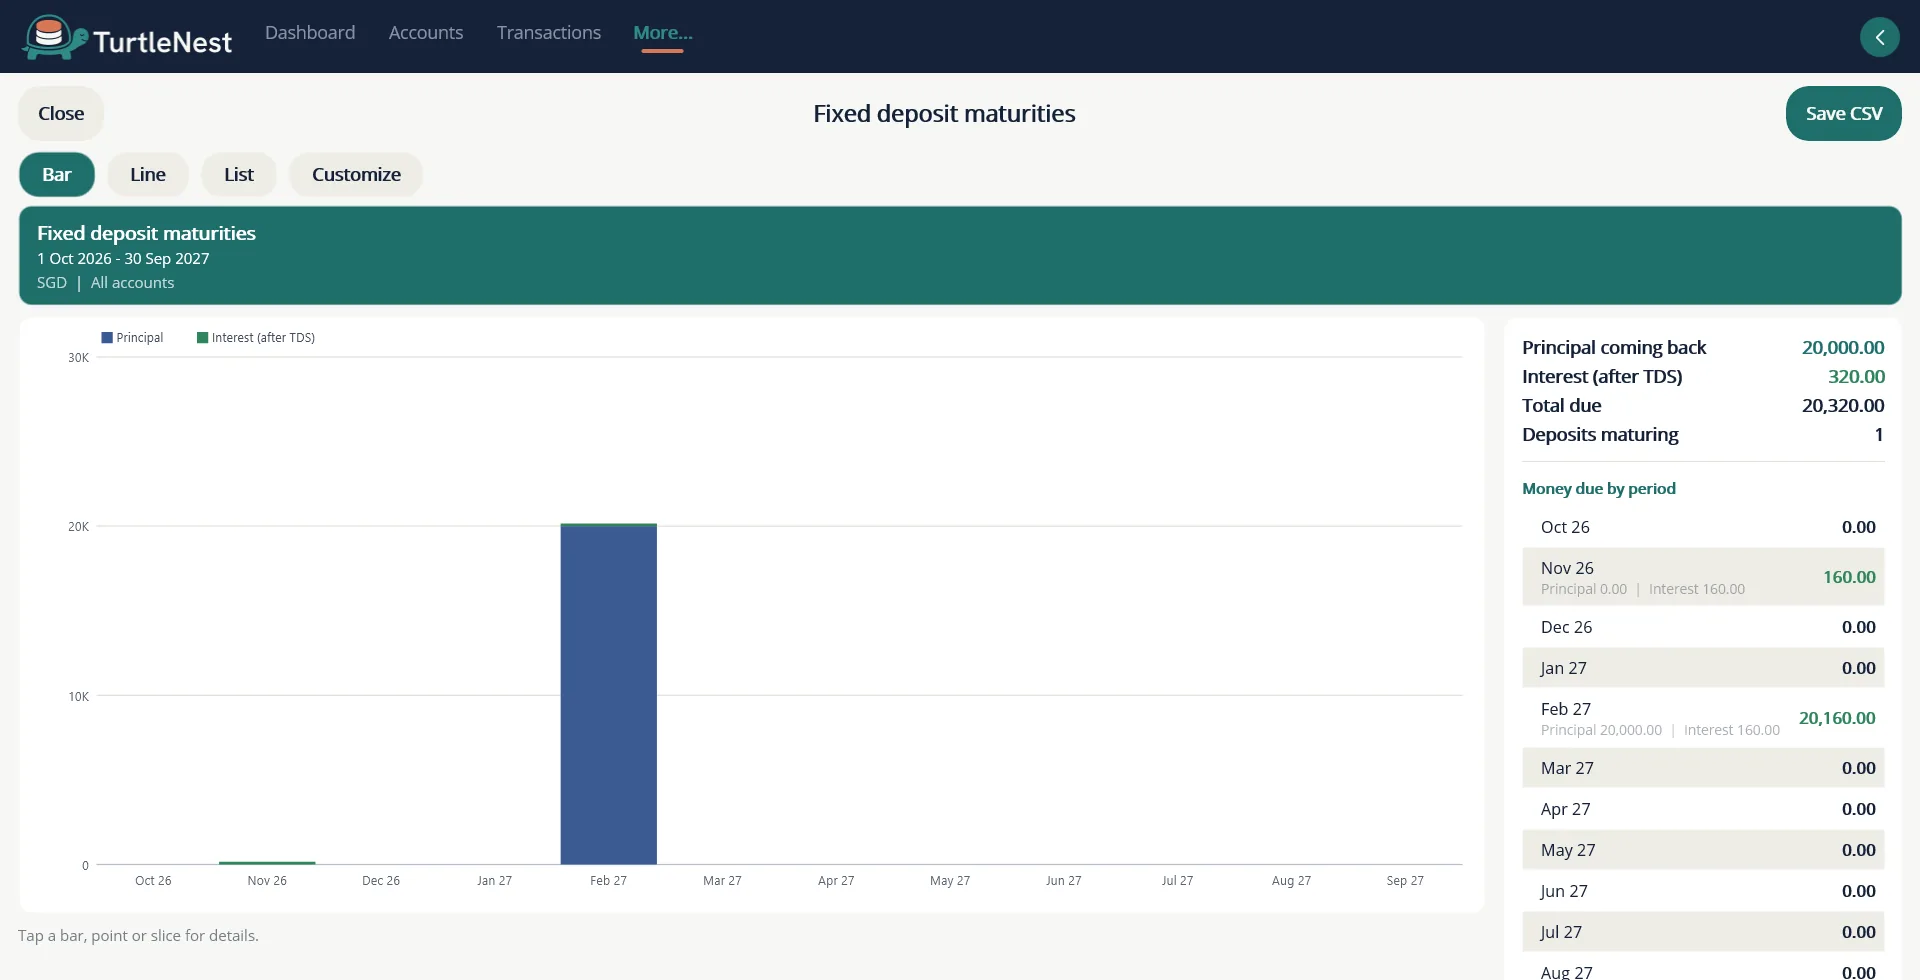
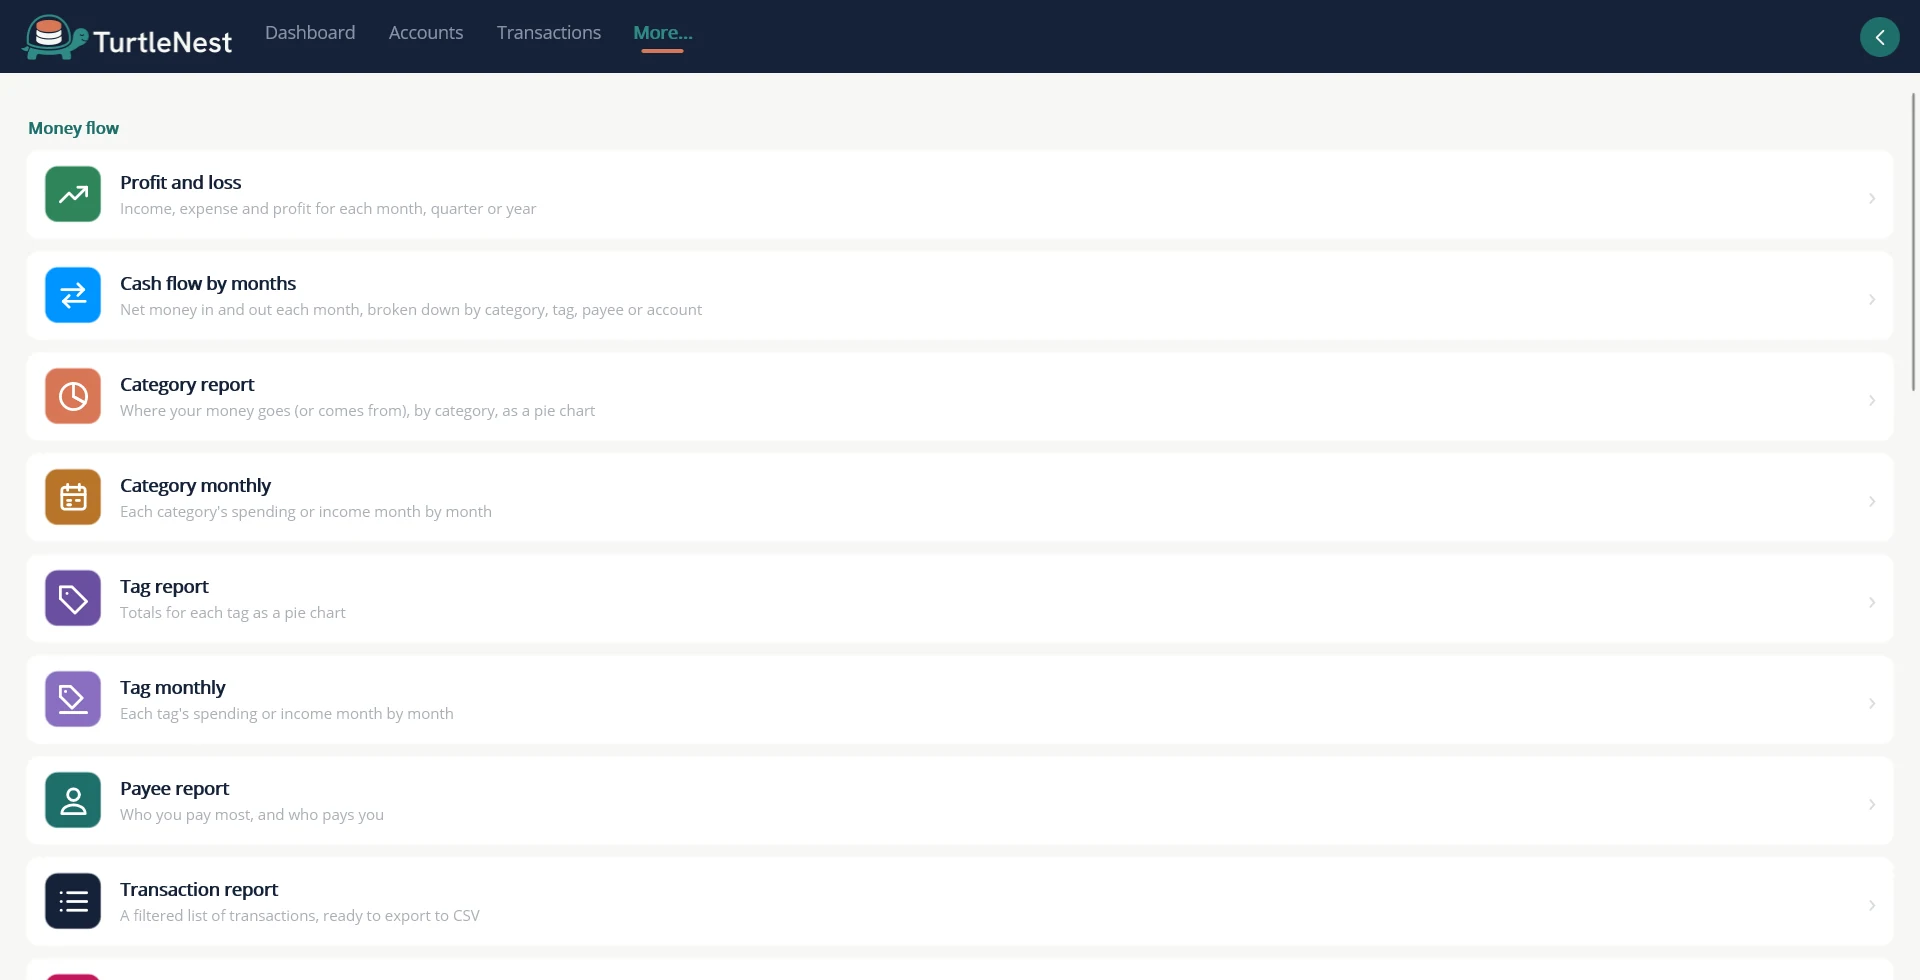
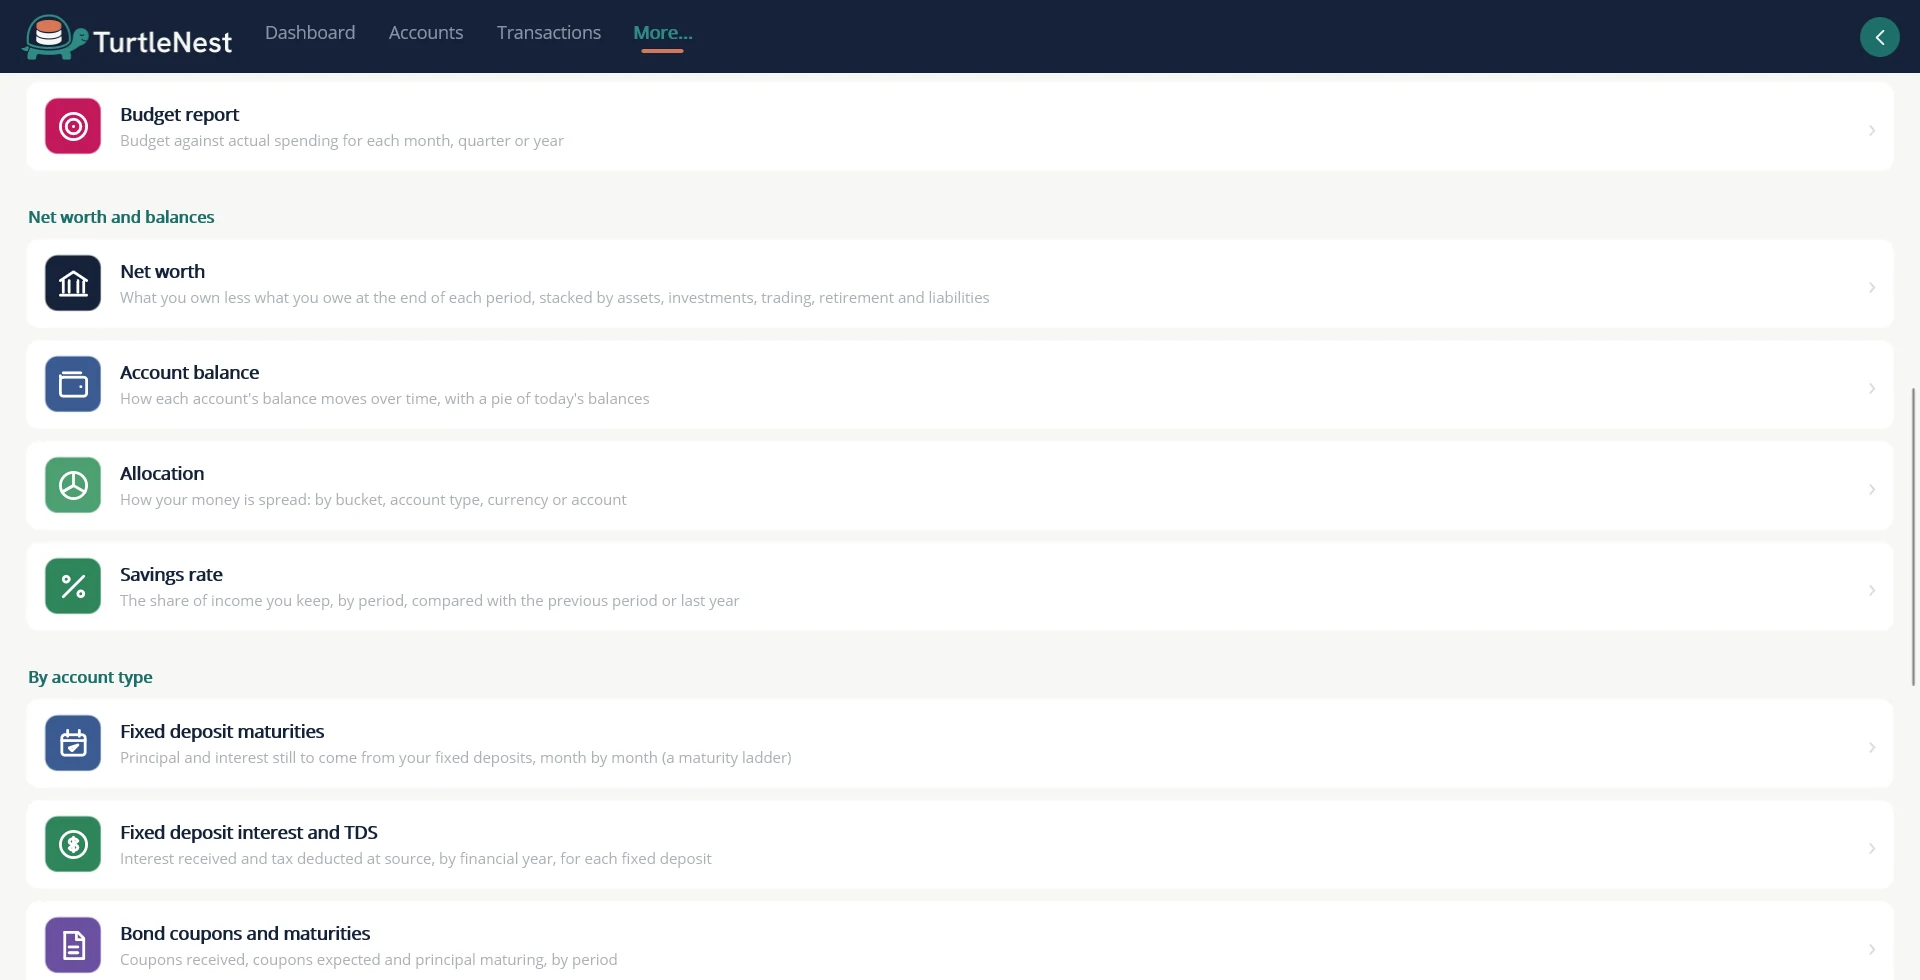
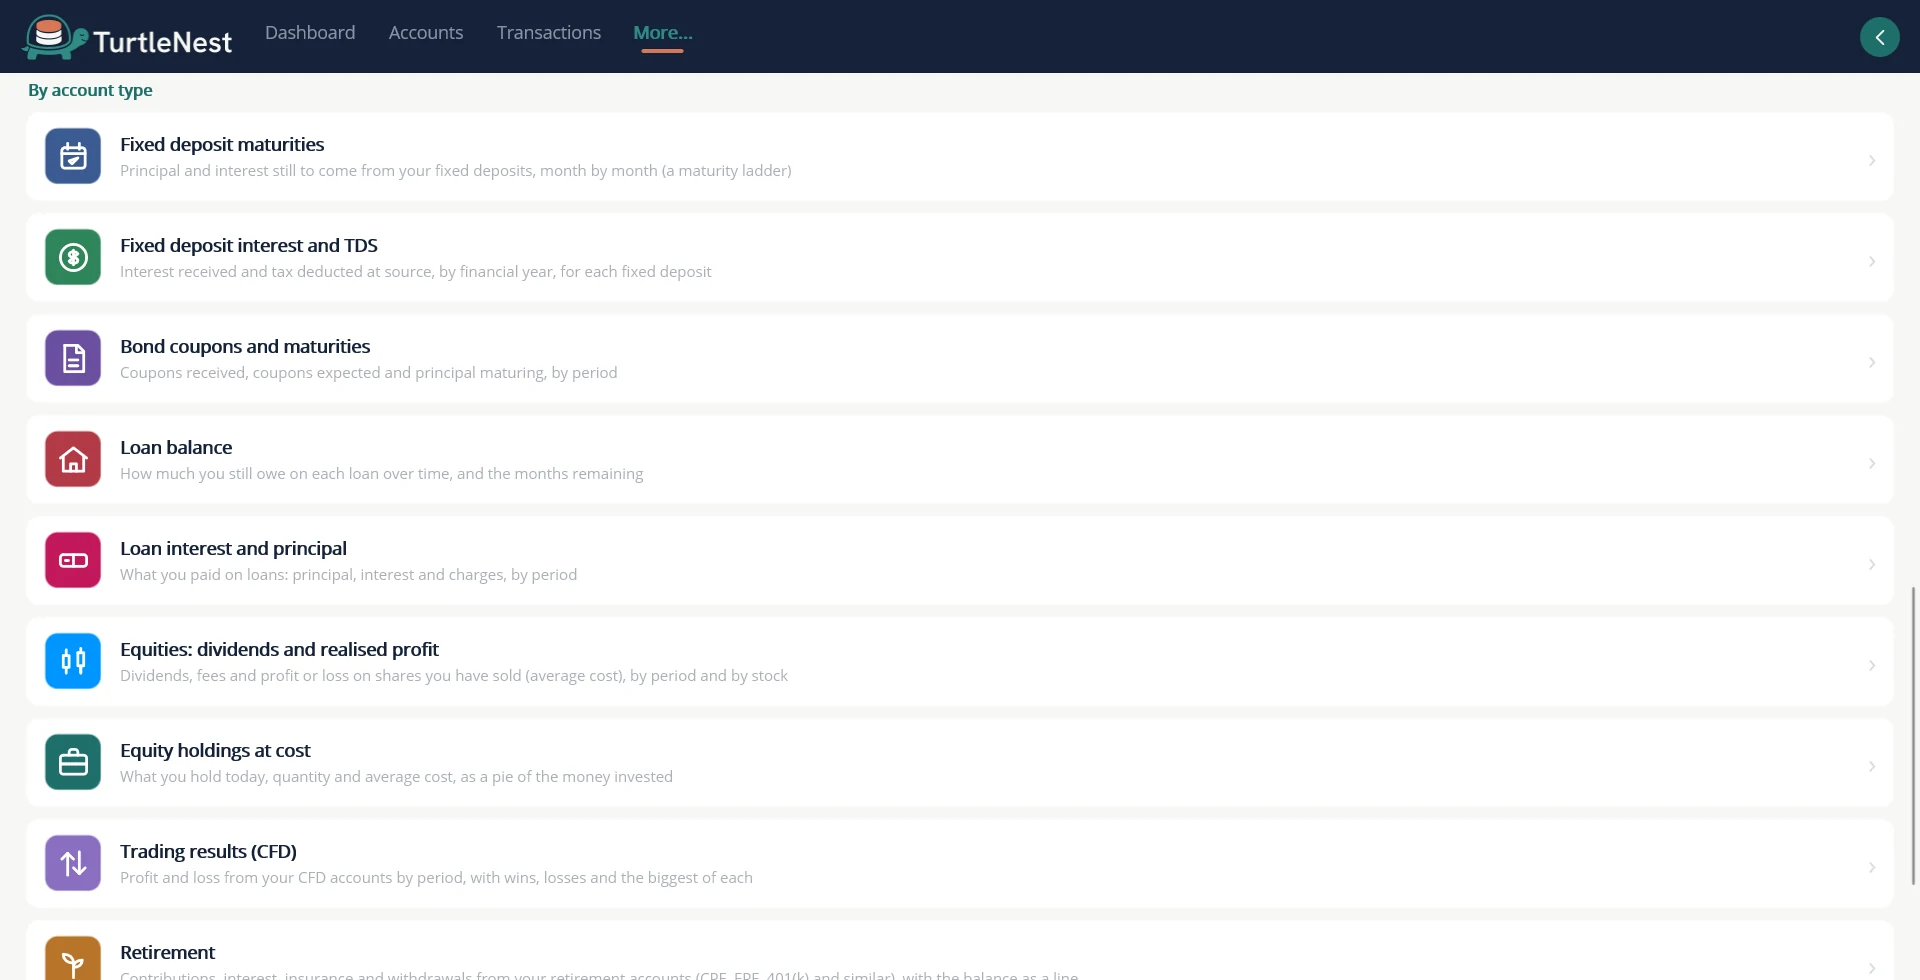
Twenty-three reports, and you choose the period.
From cash flow to savings rate, each report can run by month, quarter, financial year, half-year or calendar year.
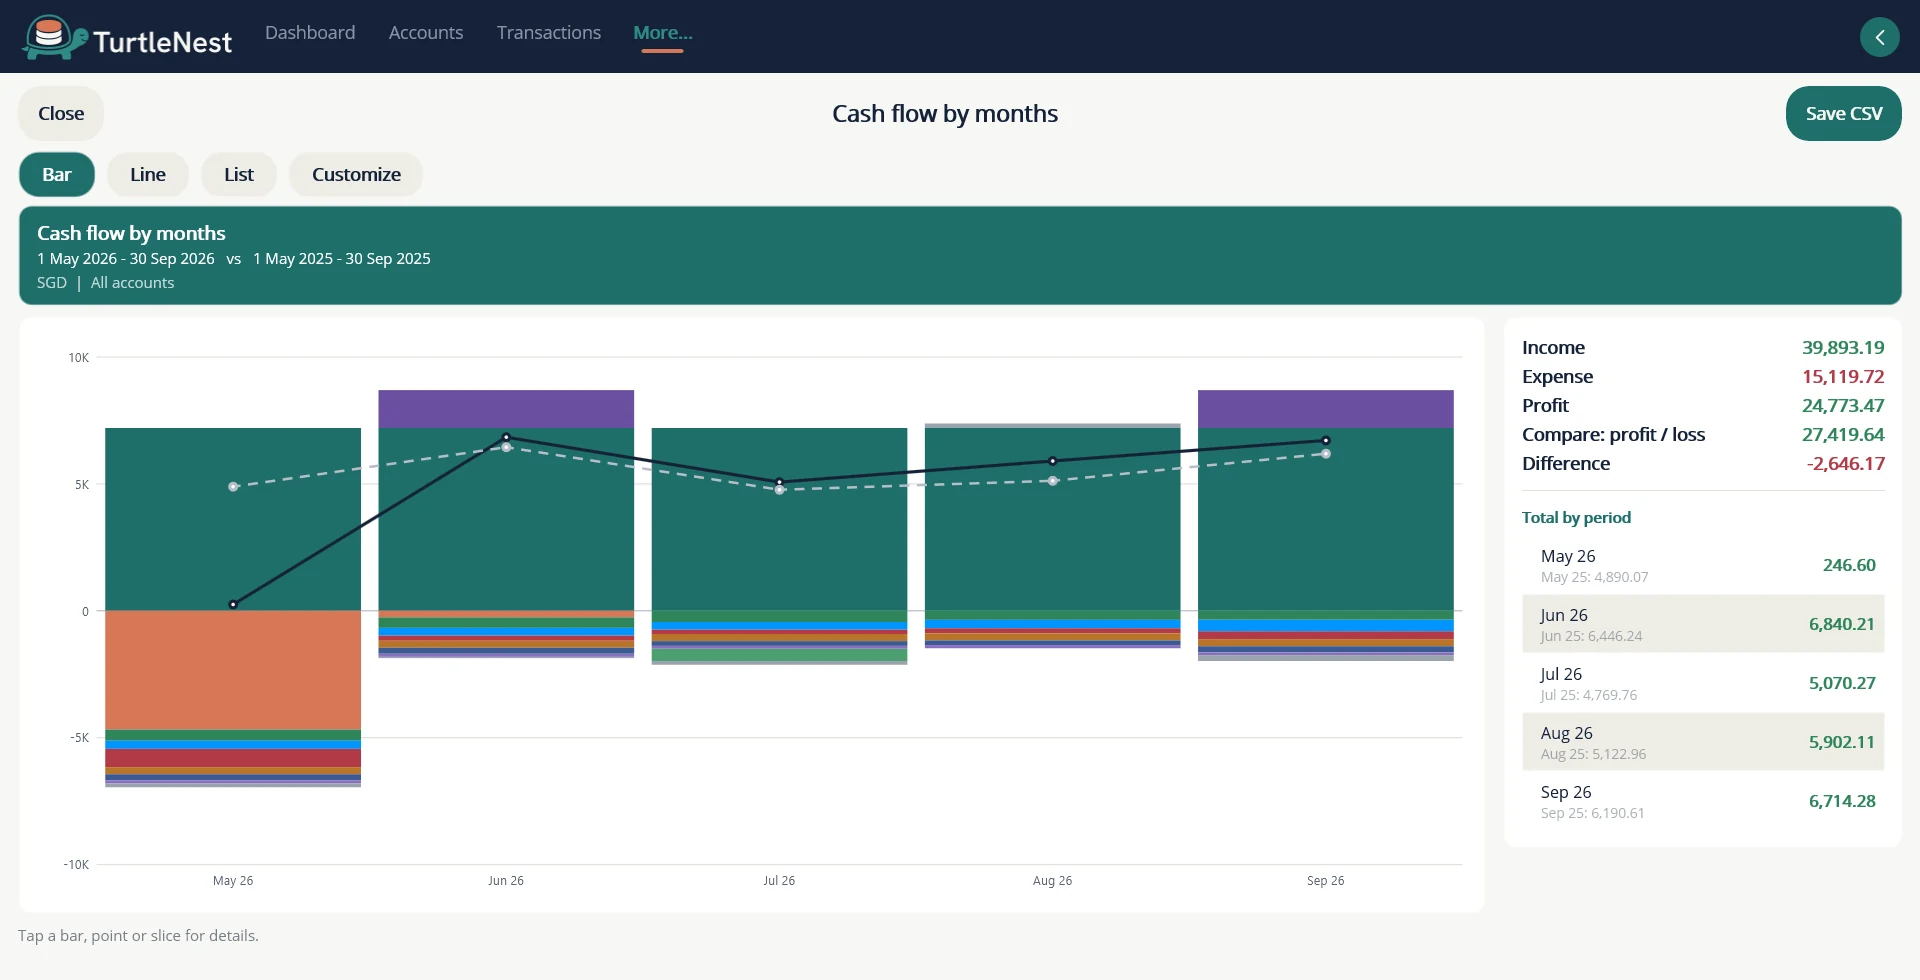
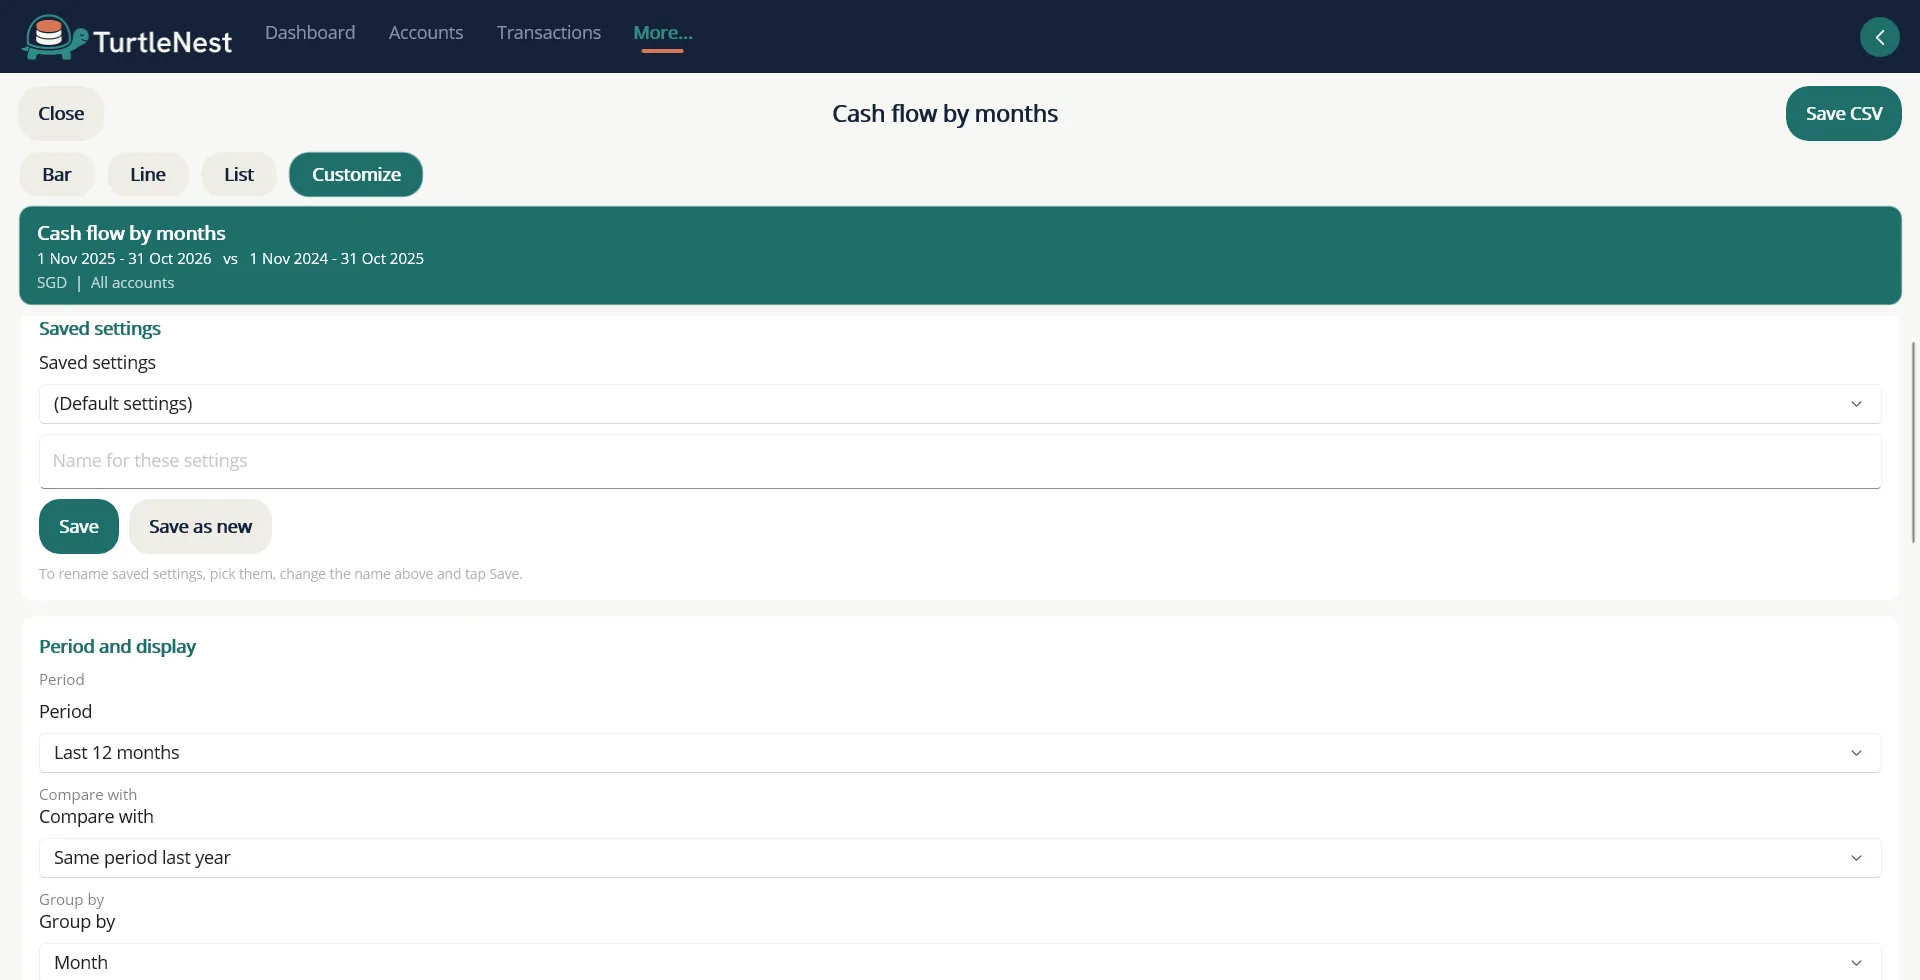
- Pick the period and the bucketsMonth, quarter, financial year, half-year, calendar year; or all time.
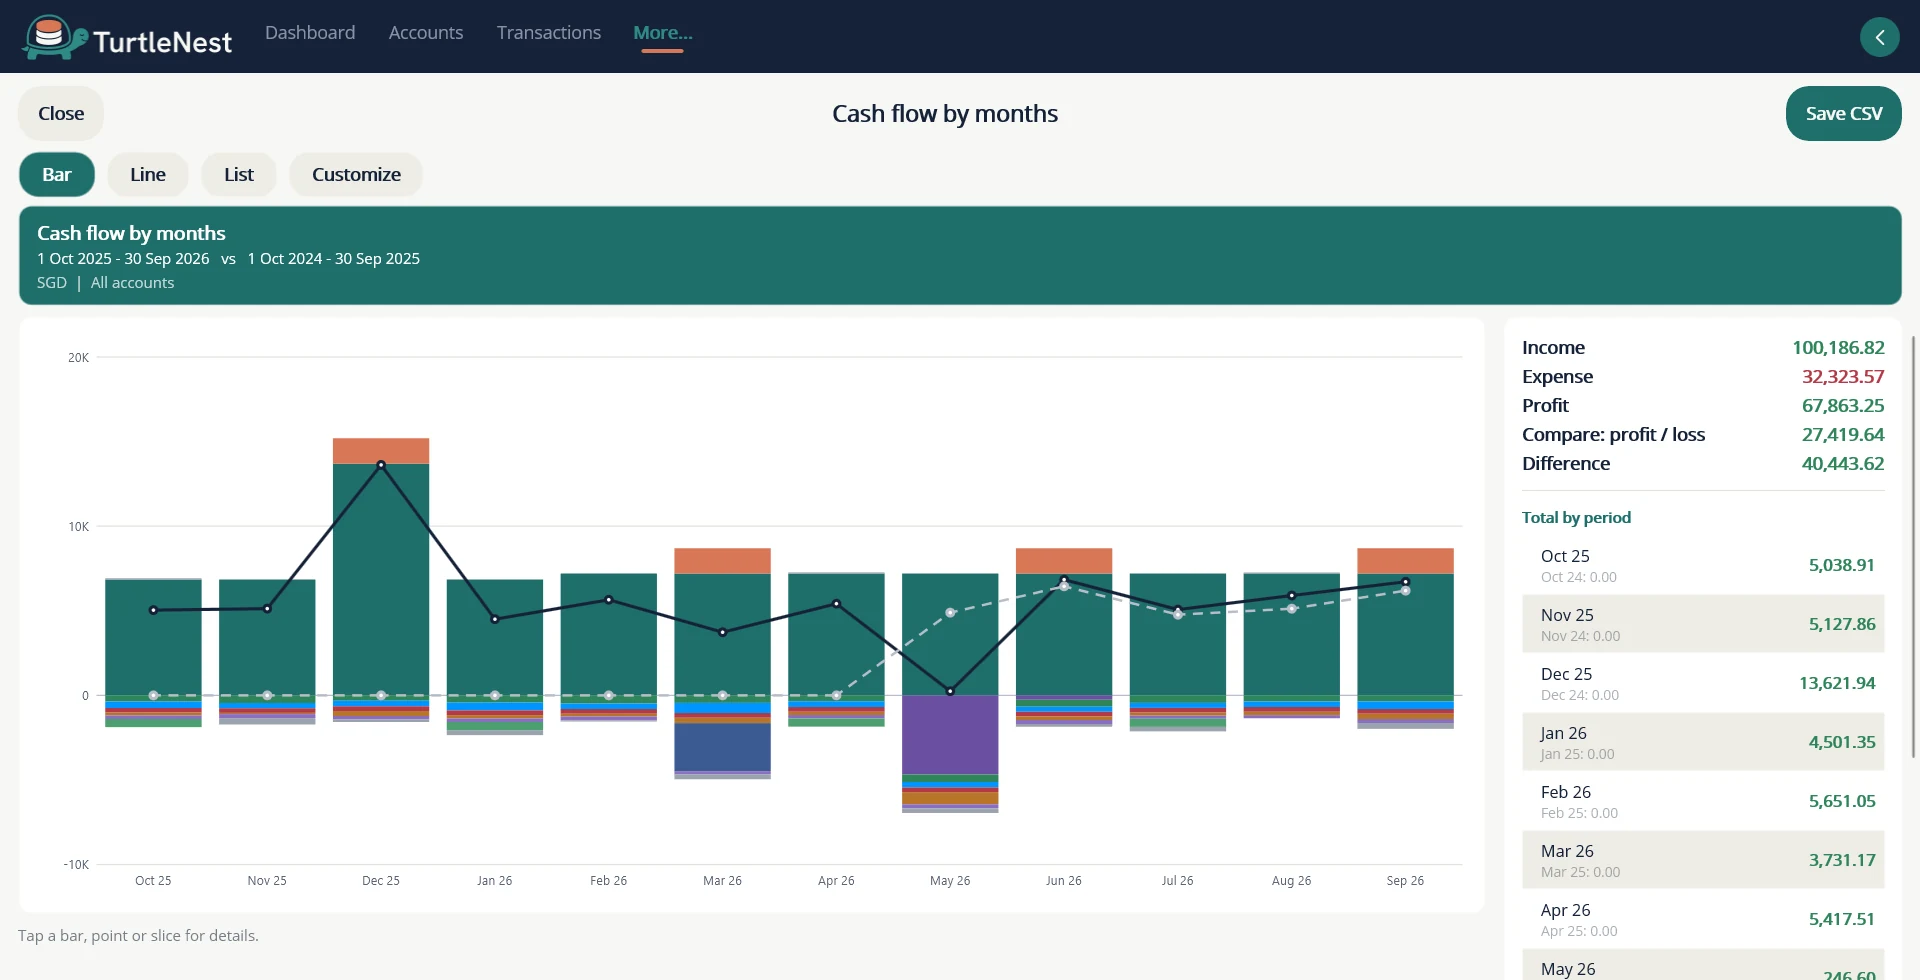
- Compare with an earlier periodA side-by-side table shows each figure and its change.
- Export and saveDownload any report as CSV and keep your favourite setups.
Screens
More screens.
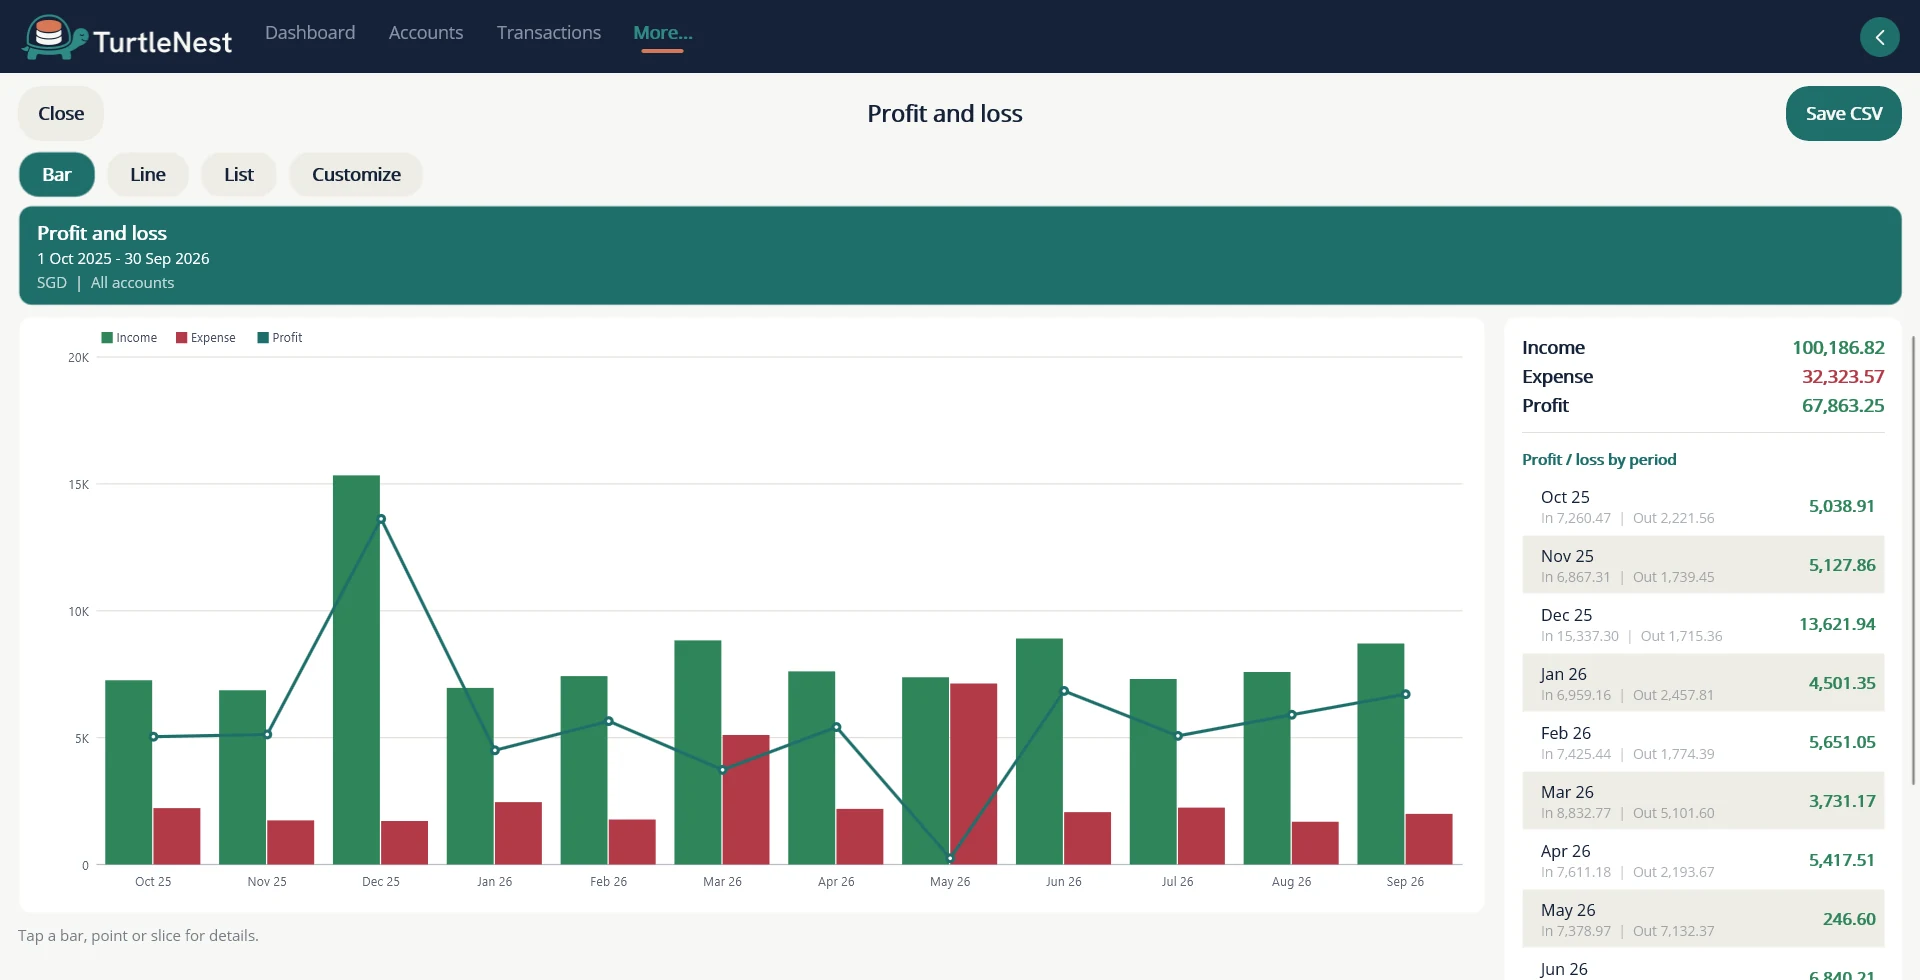
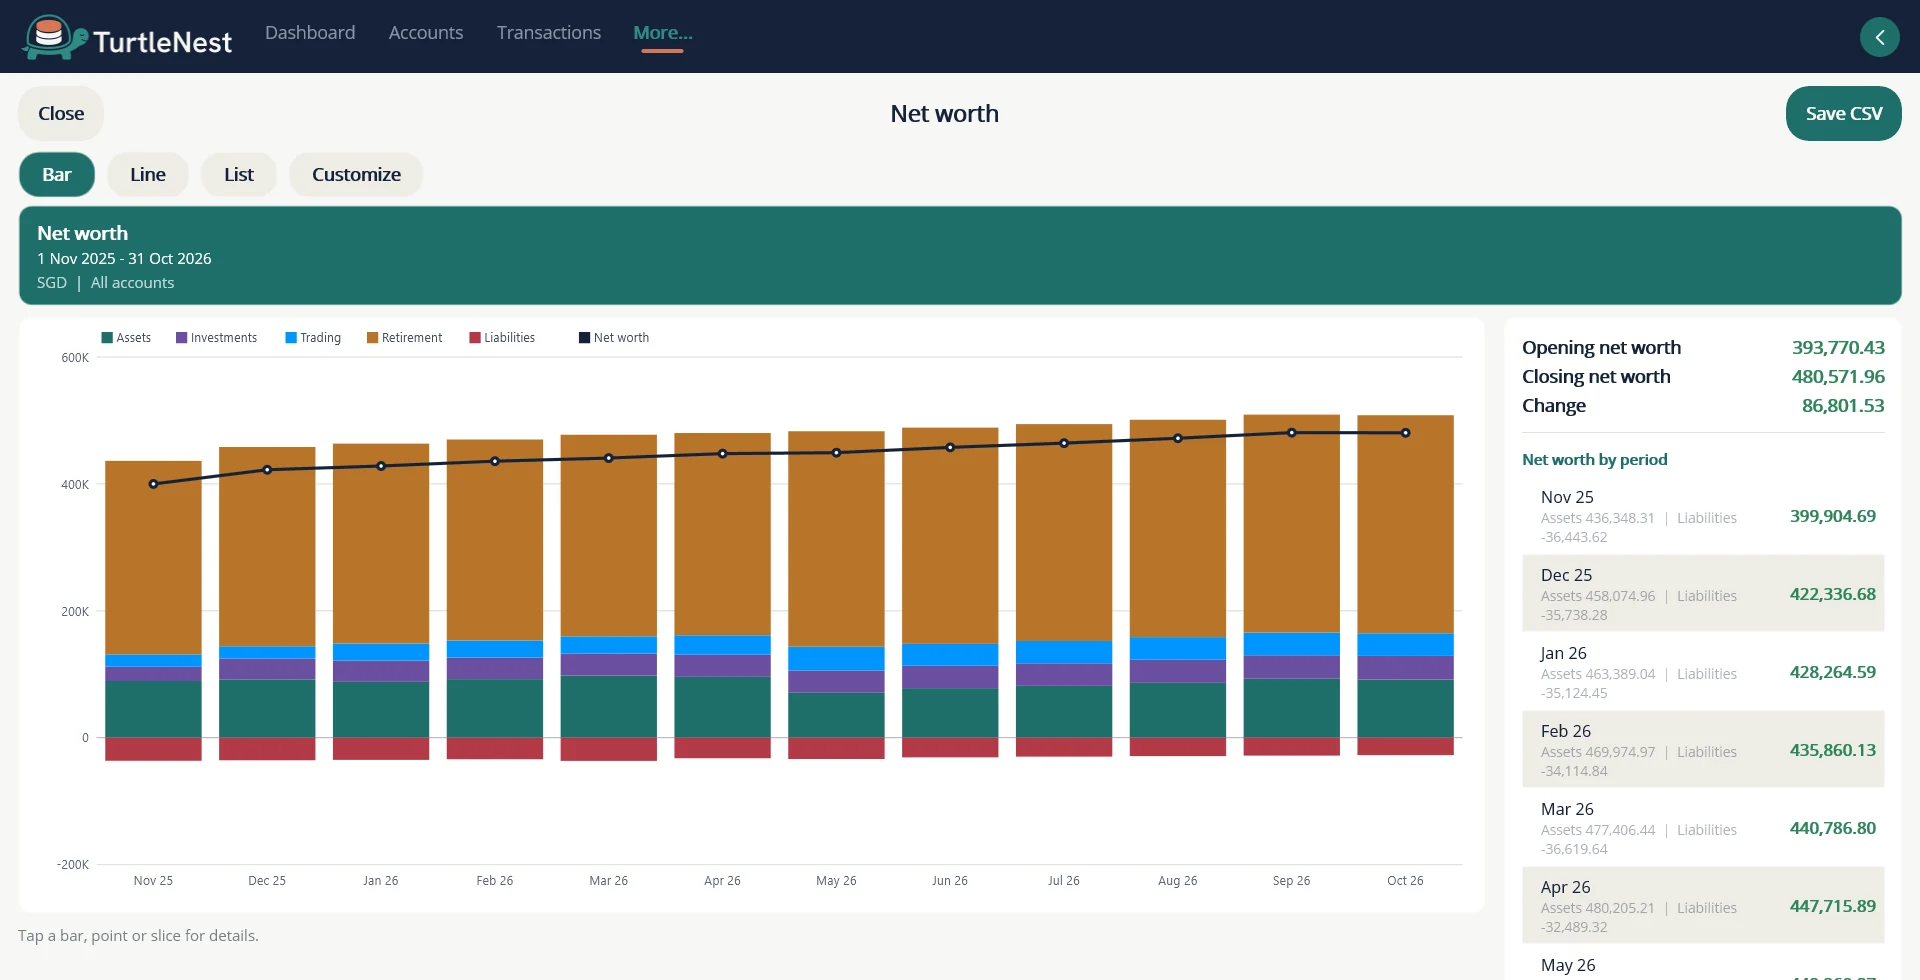
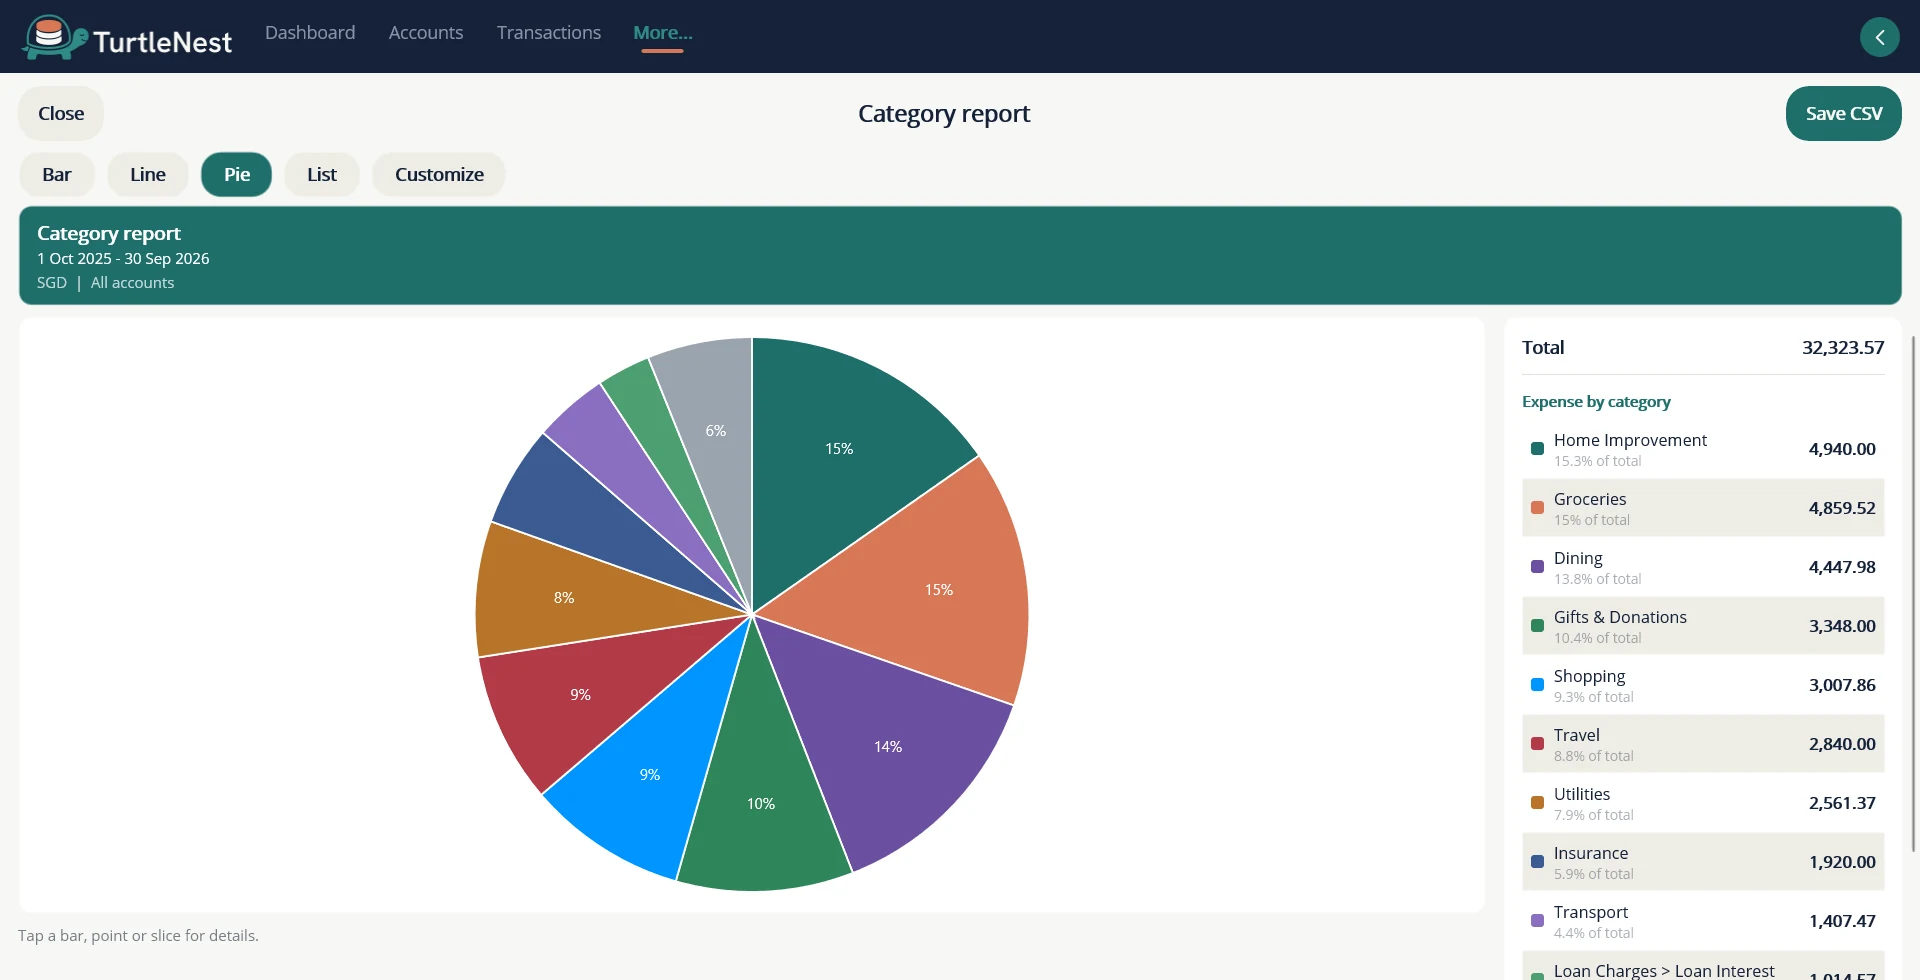
Screens
Each report has its own tile.
Also included
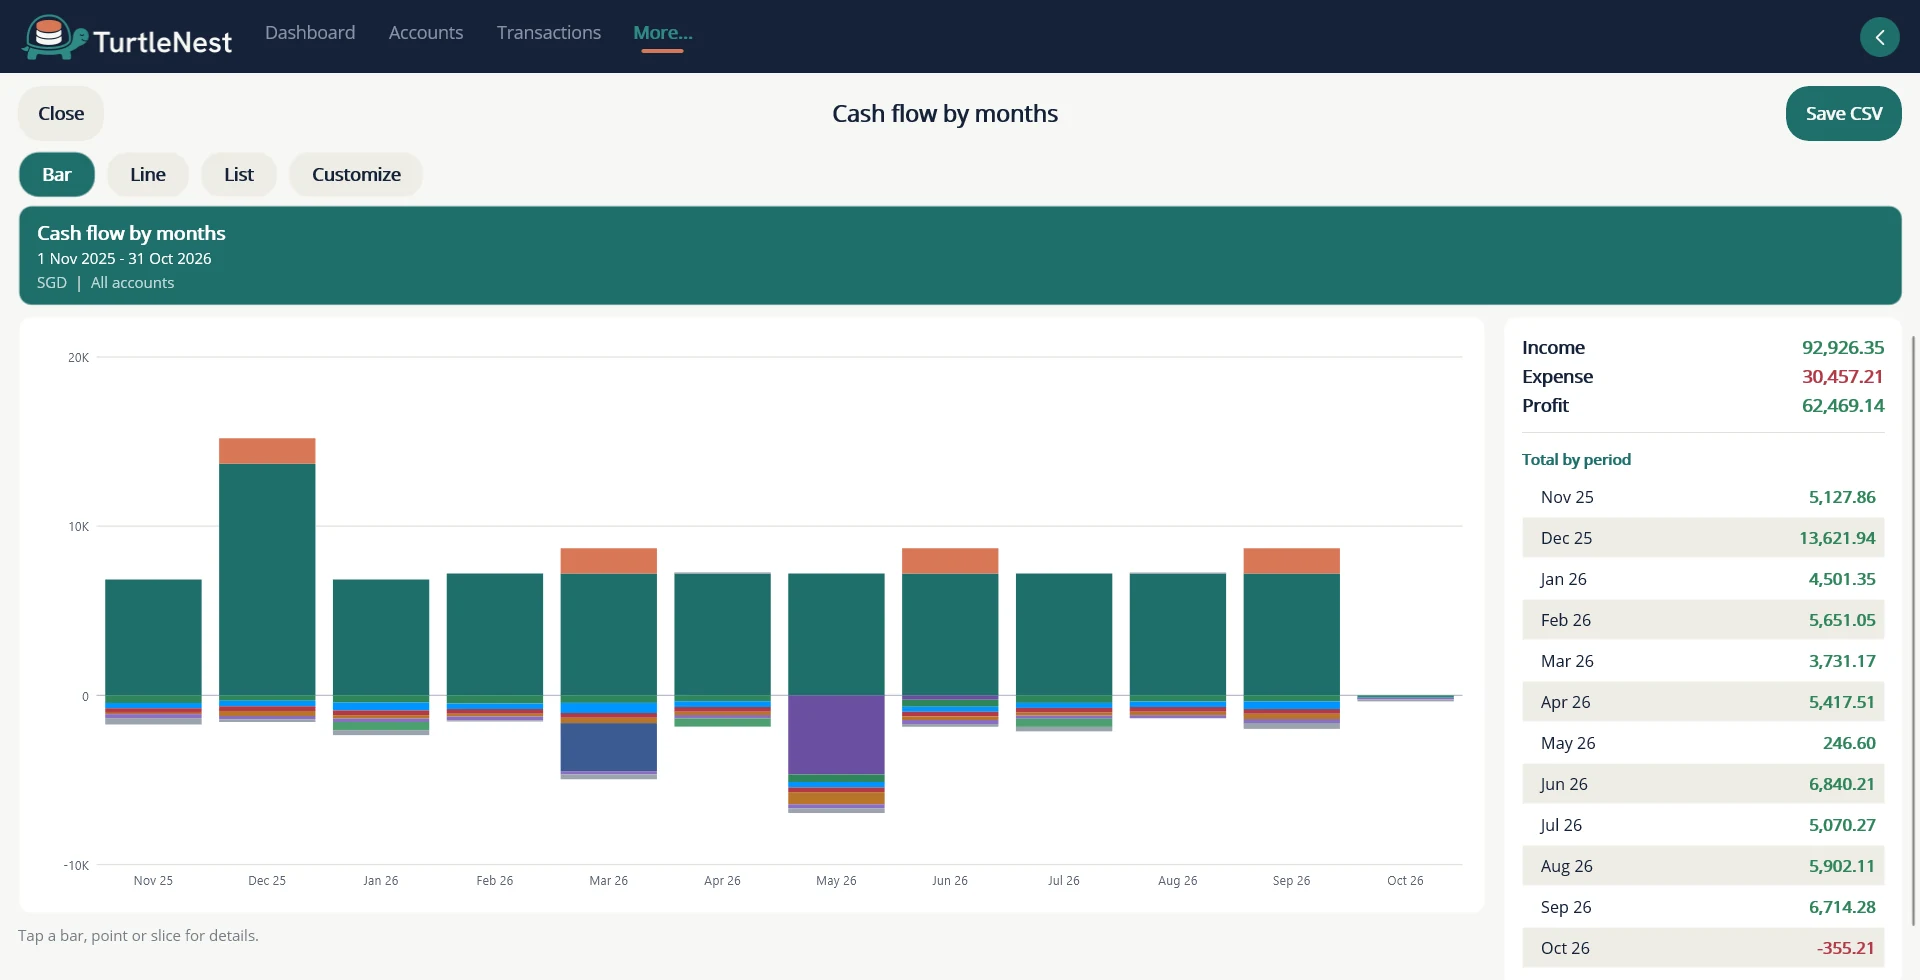
- Cash flow by monthsMoney in and out, bucket by bucket.
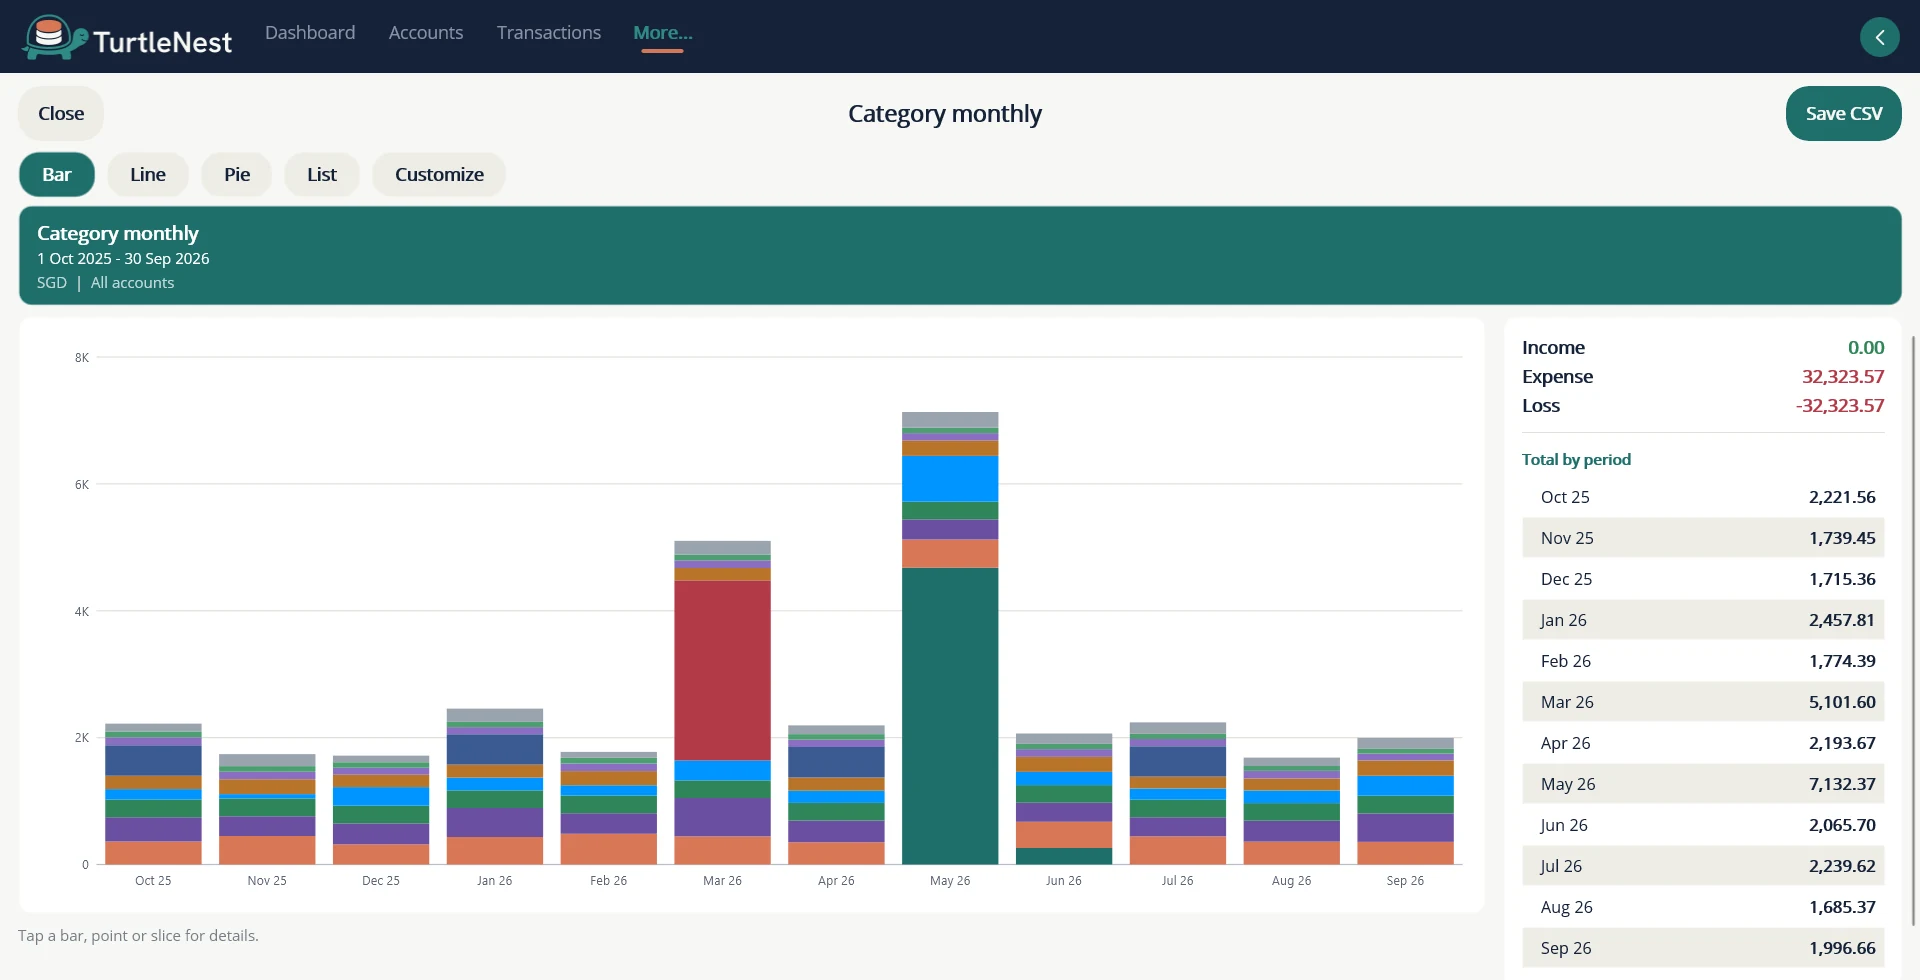
- Category and tag monthlySee which categories and tags move.
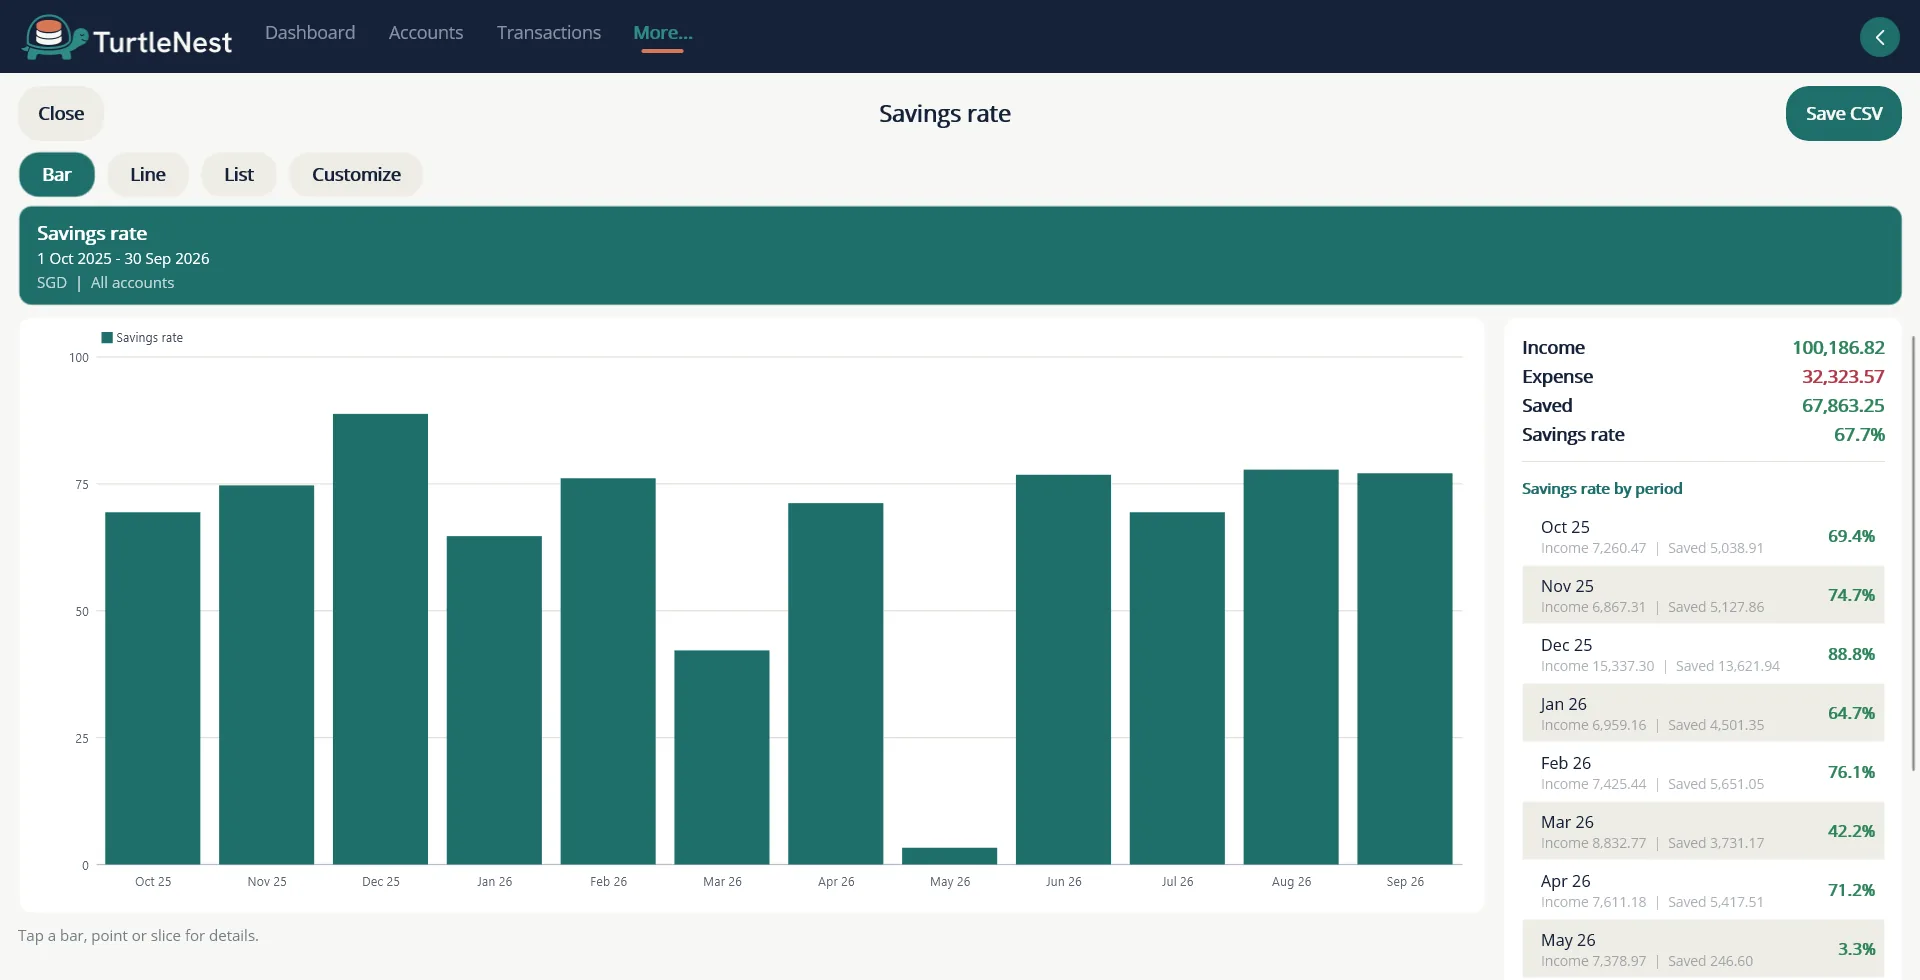
- Savings rateWhat you kept, against what you earned.
- And moreEighteen further reports, each with a line icon on the Reports home.
On Android
The same screens, rebuilt for a phone. Android screenshots come once the Android app is built.
Reports home
Report with chart